Marine Debris
If you’ve spent any time on Fishers Island’s beaches, you’ve probably noticed how clean our shoreline is.. That’s largely thanks to Michele Klimczak, our Marine Debris Coordinator, who runs our program that’s grown into regular cleanups paired with real data collection and tracking across the island. Every piece that gets picked up is weighed, logged, and tied to a specific zone, which sounds a little tedious, but it’s actually what makes this program more than just cleanup. That data tells us where debris tends to pile up, whether certain storms or seasons bring in more of it, and how this work is making a dent over time.
Collected by Month
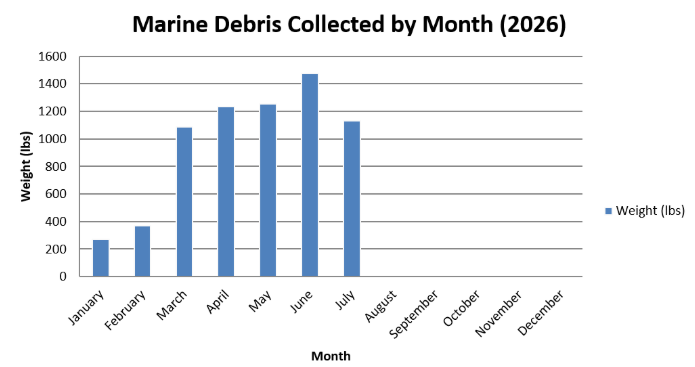
Debris collection stayed relatively light through the winter and climbed steadily as the weather warmed and beach traffic picked up. June was the summer’s biggest month so far, with 1,473 pounds collected, and July followed closely behind at 1,133 pounds. Combined, that’s already over 2,600 pounds pulled off the island’s beaches across just those two months.
So why is it such an increase in debris heading into summer? A few factors likely play into it. Warmer weather brings more people to the island’s beaches, which naturally means more foot traffic and more opportunity for debris to accumulate along the shoreline. At the same time, summer is peak season for boating and fishing activity throughout Long Island Sound, both locally and along the Connecticut coastline, and that increased activity tends to bring more lost or discarded gear, traps, lines, and buoys, washing ashore. Warmer months can also mean more frequent storms and stronger tidal patterns, which can carry debris in from further offshore. Together, these seasonal shifts in both human activity and ocean conditions likely explain why debris totals climb through the summer months.
Collected by Zone

To understand why some zones collect more debris than others, it helps to know what each one covers.
N1: Airport Beach, Silver Eel Cove, Little Stony, Hay Harbor Club Beach, Holiday House
N6: South Dumpling Beaches, Grey Gulls, Beach at Stables, Dock Beach, North Hill
N5: Clay Point Road Beaches, Chocomount Cove, Hungry Point, East Harbor
E4: Latimer Light Beach, Beaches to Left of Castle Road, Houghton Beach, Beaches Behind Money Pond
S2: The Race, Sanctuary of the Sands, South Beach, Wilderness Point, Isabella Beach
S3: Chocomount Beach, Beach Before Fishers Island Club
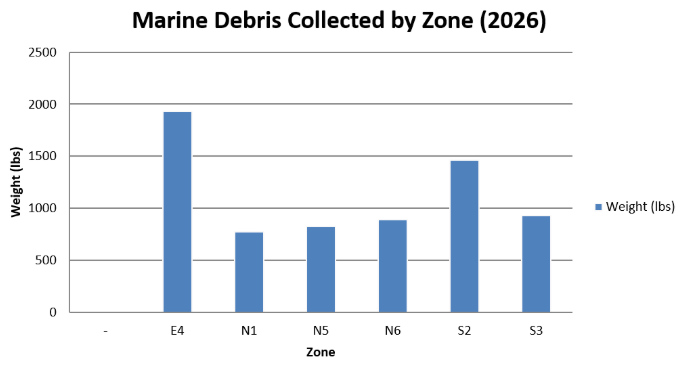
Zone E4 has consistently pulled in the most debris this summer, and its position helps explain why. Sitting at the eastern tip of the island, it’s directly exposed to the confluence of Long Island Sound and Block Island Sound, an area where converging currents from multiple directions tend to concentrate floating material rather than carry it past. Zones S2 and S3, both on the island’s south-facing shoreline, aren’t far behind, likely because they’re more exposed to open water and prevailing wind and wave patterns coming up from Block Island Sound, compared to the more sheltered north shore zones like N1, N6, and N5.
FIRST Research Team
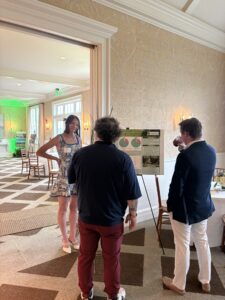
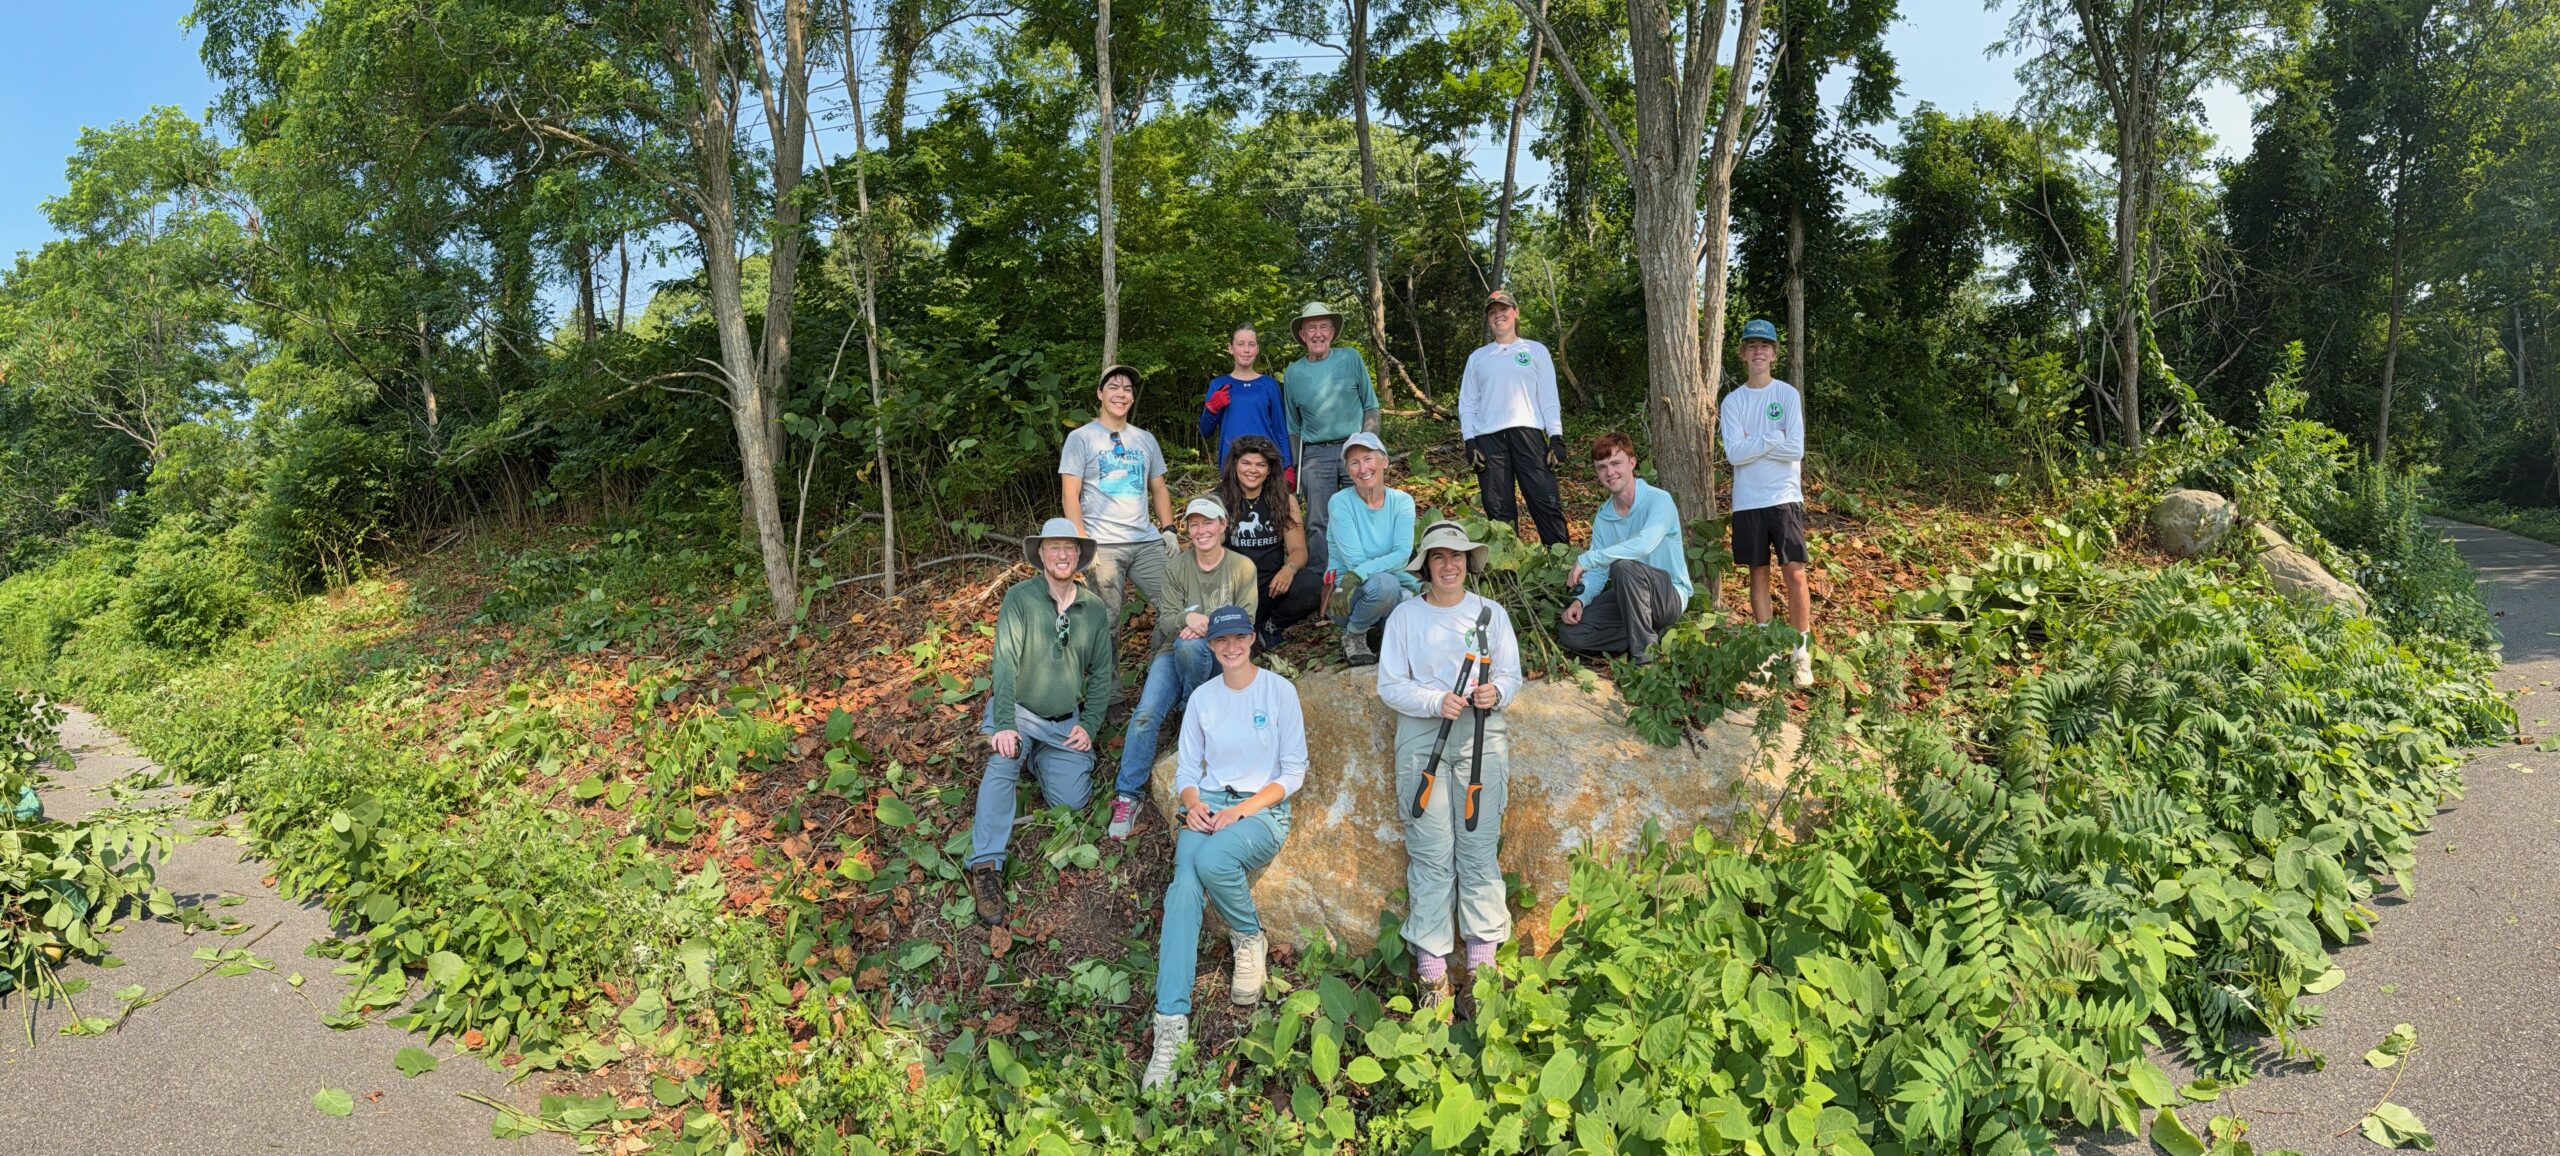
The Fishers Island Research and Survey Team (FIRST), a partnership between the Conservancy and Tarleton State University, spent another summer in the field collecting data across the island, on birds, insects, plants, and soil, that will help guide conservation decisions for years to come.
By the Numbers
- Plant-insect study, now complete after 3 years: 15 transects, 150 pitfall traps, 75 vacuum samples, and 75 vegetation plots collected this season alone, wrapping up a three-year effort to track plant and insect communities across Conservancy properties. This dataset will eventually be compared to similar research from about a decade ago, offering a rare look at how the island’s biodiversity has shifted over time.
- Breeding bird surveys, June and July: 42 species documented during the June 14th survey, including a Scarlet Tanager and Willow Flycatcher among the highlights. That number jumped to 52 species and 228 individual birds during the July 25th survey, conducted across 15 survey points using a mix of visual ID and confirmed vocalizations. Because breeding birds respond quickly to changes in habitat, these counts help track the health of the island’s nesting population year over year.
- Soil research (Natalie Sato): 250 topsoil samples collected on island, plus another 150 brought back to Grinnell College, as part of ongoing research into whether invasive knotweed leaves lasting chemical effects in the soil after removal.
- Arthropod research (Naomi Zahn): 10 vegetation plots, 20 pitfall traps, and 10 vacuum samples collected to study how mowing invasive knotweed affects the insects and spiders living in it.
- Community volunteering: 36 hours logged across three events, Pollinator Pathways (8 hours), Ferry Park (24 hours), and FI Seagrass (4 hours).
- Community survey: 160+ respondents so far to Tyler McMahon’s ongoing survey, with more responses still needed for a complete analysis.
Shorebird Monitoring
Piping Plover and Least Tern monitoring on island is run by our Field Director, Anna White, in collaboration with the NYSDEC and the Long Island Colonial Waterbird and Piping Plover Survey. Here’s a look at what this season’s numbers added up to…
By the Numbers (2026 Season)
- 4 active monitoring sites this season: Eighth Hole Beach, Big Club Beach, Middle Farms Beach, and South Beach, each tracked throughout the nesting and chick-rearing period.
- 22 Piping Plover eggs laid across the island, with 17 chicks hatched and 9 confirmed fledged. That works out to a 77.3% hatch rate and a 52.9% fledge rate, or an overall productivity of 1.8 chicks fledged per breeding pair, a solid number for a species facing this many natural and human pressures each season!
- Big Club Beach had the standout turnaround of the year. After 0 nesting activity in 2025, a pair returned this season, hatched all 4 eggs from a full clutch, and fledged 3 of the 4 chicks, a big jump in productivity for a site that had struggled in recent years.
- Middle Farms Beach delivered the cleanest season of any site. A single pair hatched 3 chicks from a full clutch of 4, and all 3 made it to fledging with no documented losses. The site’s natural shelter and lower foot traffic likely played a role in that outcome.
- Eighth Hole Beach hatched a full clutch, but had a harder road to fledging. All 4 eggs hatched successfully, but only 1 chick made it to fledging this season. The site faces recurring pressure around the July 4th holiday from heavy boat traffic and beachgoers, and this year’s brood also dealt with weather and predation challenges during the chick-rearing period.
- South Beach was a site of mixed outcomes this season. Two Piping Plover pairs nested there across three nest attempts, together hatching 6 chicks and fledging 2. At the same time, the site’s Least Terns had their best season yet, with 5 fledged chicks between the pairs tracked there and a nest discovered partway through the season, more than any other site or species combination this year.

Photo by Naomi Zahn
Island Sentinel Program
For over a decade, the Island Sentinel Program has been one of the Conservancy’s longest-running youth stewardship programs, connecting local knowledge with hands-on conservation work and giving youth a role in observing and caring for our islands natural environments. Over the years, Sentinels have documented everything from wildlife and shoreline conditions to marine debris and seasonal ecological change across the island’s monitoring sites. In 2025, a significant effort went into reviewing that historical dataset, and one thing stood out clearly- over 70% of everything ever recorded was bird-related.
That finding shaped a deliberate shift for the 2026 season. Rather than continuing to track a wide range of categories, this year’s approach leaned into what the data showed was already the program’s strength: bird observations. Sentinels were assigned specific sites to visit consistently, given standardized routes, and asked to record GPS coordinates at the start and end of each visit. By focusing more narrowly on birds and standardizing how that data gets collected, the program is aiming for the ability to compare biodiversity across sites, track seasonal patterns in which species are using different parts of the island, spot ecological shifts and notable events as they happen, and build a comparable, long-term record. Digital data collection and direct integration with the islands iNaturalist project reinforce that goal, giving every observation a timestamp, GPS location, and photo verification. None of this changes what the program has always been at heart, an approachable, hands-on way for the youth to get outside and pay attention to the island around them.
By the Numbers
This season, 3 Sentinels logged 86 visits across all 10 of the program’s official monitoring sites between June and mid-August, a strong first season for the program’s more structured, site-based approach.
Those 86 visits added up to an estimated 1,266 individual birds observed, spanning 42 unique species across the island. That’s an impressive amount of data for one season, and it’s exactly the kind of consistent, wide-ranging coverage the program’s 2026 changes were designed to produce.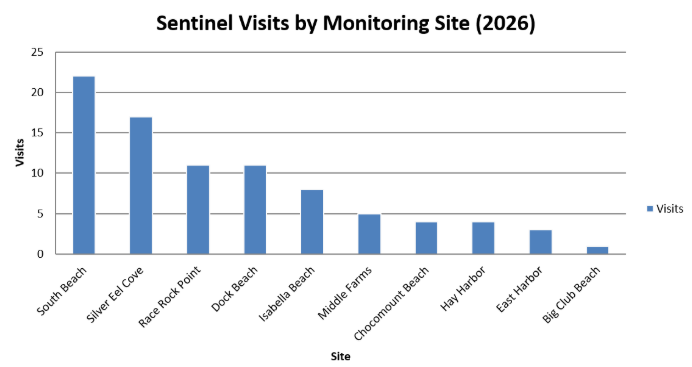
The program’s 10 monitoring sites, Silver Eel Cove, Race Rock Point, South Beach, Hay Harbor, Dock Beach, Isabella Beach, Middle Farms, Chocomount Beach, Fishers Island Club Beach, and East Harbor, represent a mix of beaches, harbors, shoreline areas, and pond environments established over the program’s history to give a broad, island-wide picture of wildlife activity. That said, coverage wasn’t even across every site. A few sites, like South Beach and Silver Eel Cove, saw far more consistent visits than others, while a couple of the more historically included sites saw only light coverage this season. As a pilot year for this more structured approach, that’s exactly the kind of information we wanted this season to surface. Going forward, we’ll be looking closely at which sites are producing consistent, useful data and which ones may need adjusting, whether that means expanding effort at high-value sites, reworking how a lower-traffic site gets monitored, or reconsidering whether every historical site still makes sense to keep in the rotation. The goal isn’t to lock in exactly 10 sites forever, it’s to make sure wherever Sentinels are spending their time is actually building toward that long-term, comparable record the program is working to establish.
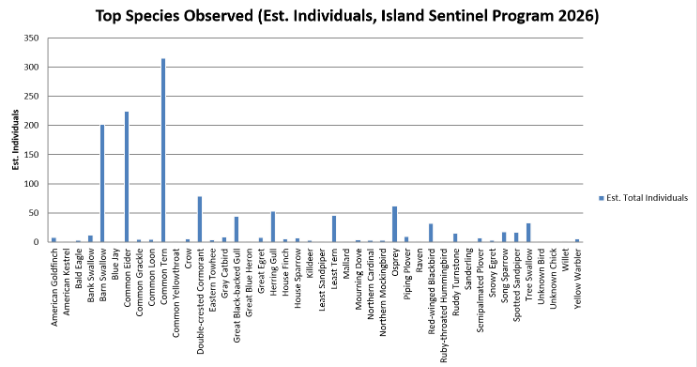
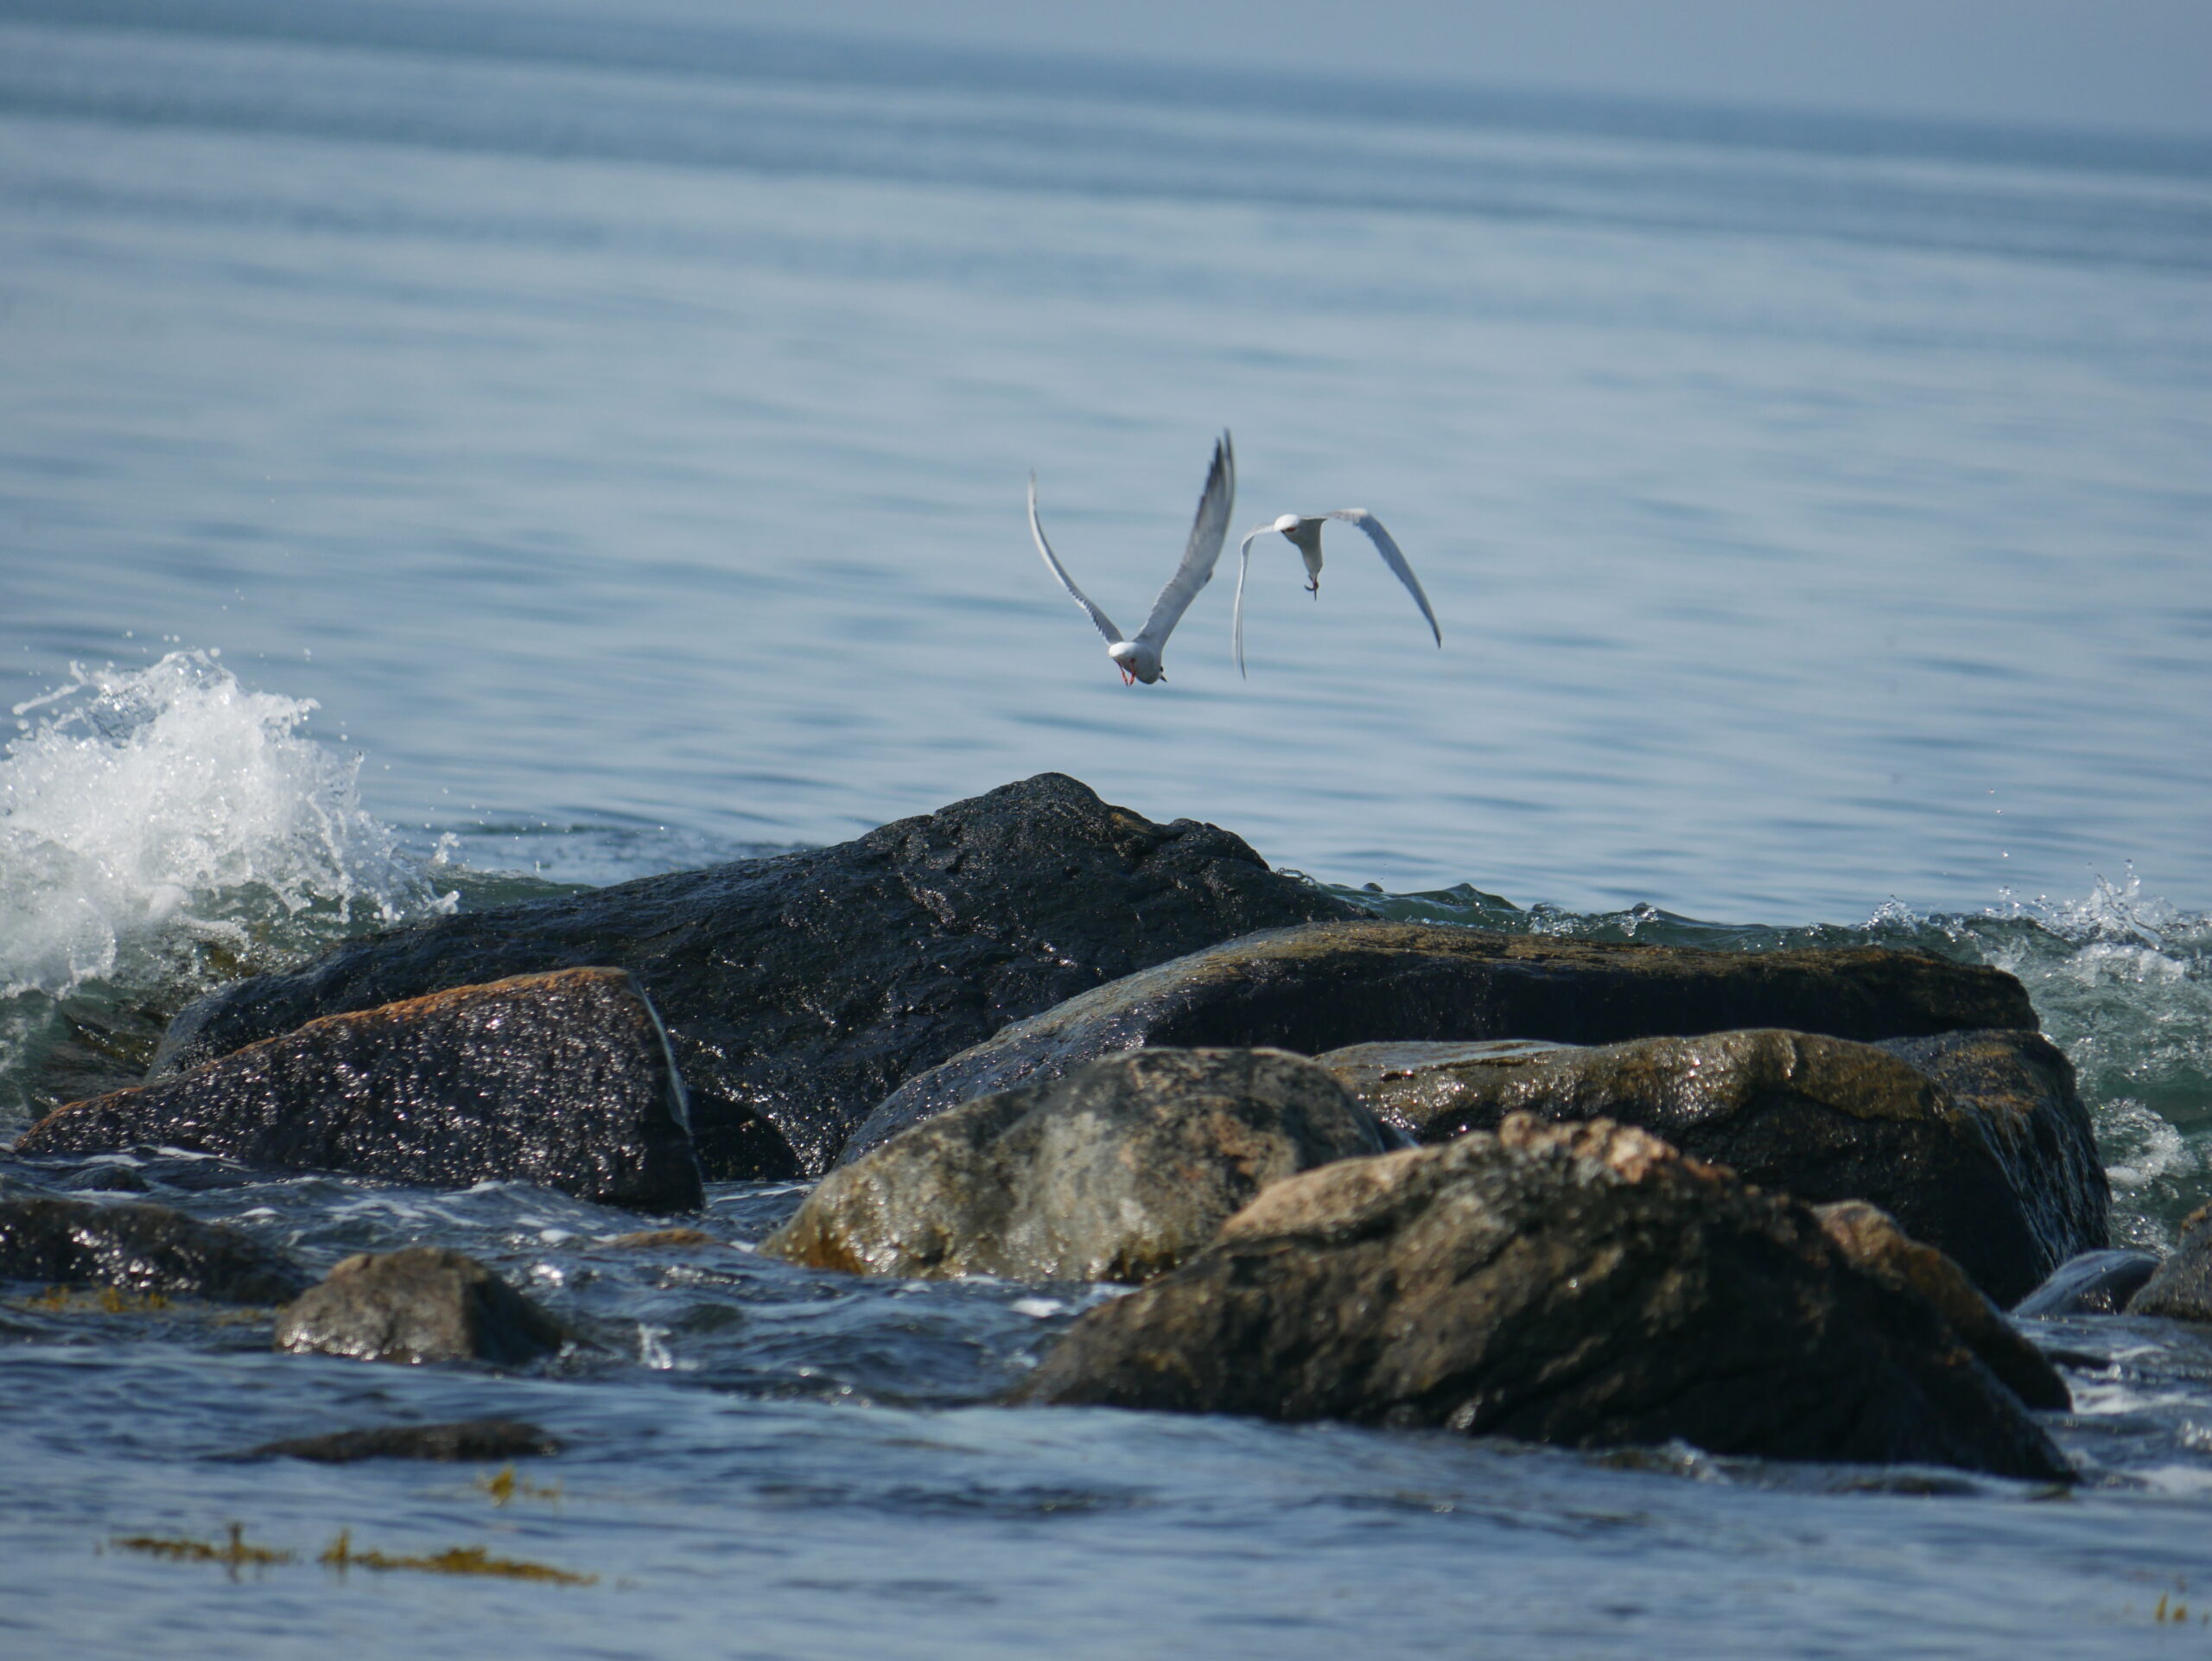
Common Tern, Common Eider, and Barn Swallow make up the largest share of individual birds recorded this season, and there’s an ecological reason behind that. All three are highly social or colonial species, meaning they naturally gather in large groups rather than being spread out individually across the landscape. Common Terns feed and roost in flocks, often diving together on schools of baitfish, which is exactly what drove two of this season’s biggest single counts, over 100 individuals recorded feeding together on more than one occasion. Barn Swallows behave similarly around structures like docks, where dozens can roost or forage together at once, which is why a single site visit could turn up 50 or more in one sighting. Common Eiders, meanwhile, gather in rafts on open water, especially outside of the breeding season, so a handful of sightings can easily account for a large share of the season’s total. These numbers aren’t showing that our island has an unusually dense population of these three species compared to everything else, they’re showing how flocking behavior concentrates individual counts around a small number of highly social species. That’s a normal and expected pattern in bird survey data, and it’s actually a good sign.Iit means Sentinels were in the right place at the right time to catch these species doing what they naturally do.
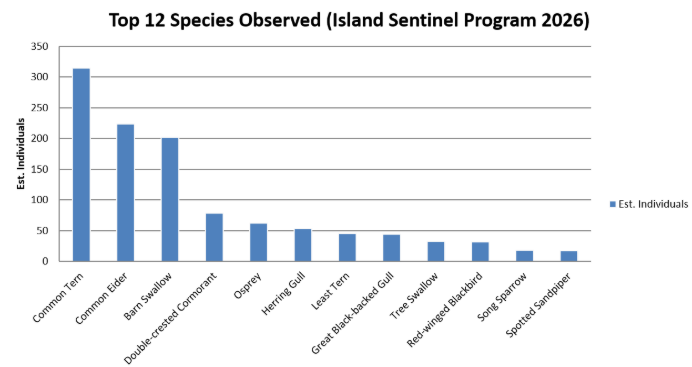
The rest of the list tells us about the range of habitats Sentinels are covering. Double-crested Cormorant, Osprey, and Herring Gull round out the next tier, all common, easily identified species that use the island’s beaches, open water, and rocky shorelines throughout the summer. Osprey in particular is a great indicator species to see well-represented, since its presence reflects a healthy local fish population and clean coastal water. Further down the list, species like Least Tern, Great Black-backed Gull, Tree Swallow, Red-winged Blackbird, Song Sparrow, and Spotted Sandpiper reflect the mix of shoreline, marsh, and upland habitat types the program’s 10 monitoring sites collectively cover. Having this many distinct species show up meaningfully across just one season, rather than the list being dominated entirely by two or three species, is a strong early sign that the more structured 2026 monitoring approach is capturing a slice of the island’s bird life, not just whatever happened to be easiest to spot.
Monarch Tagging Program (New Pilot Program)
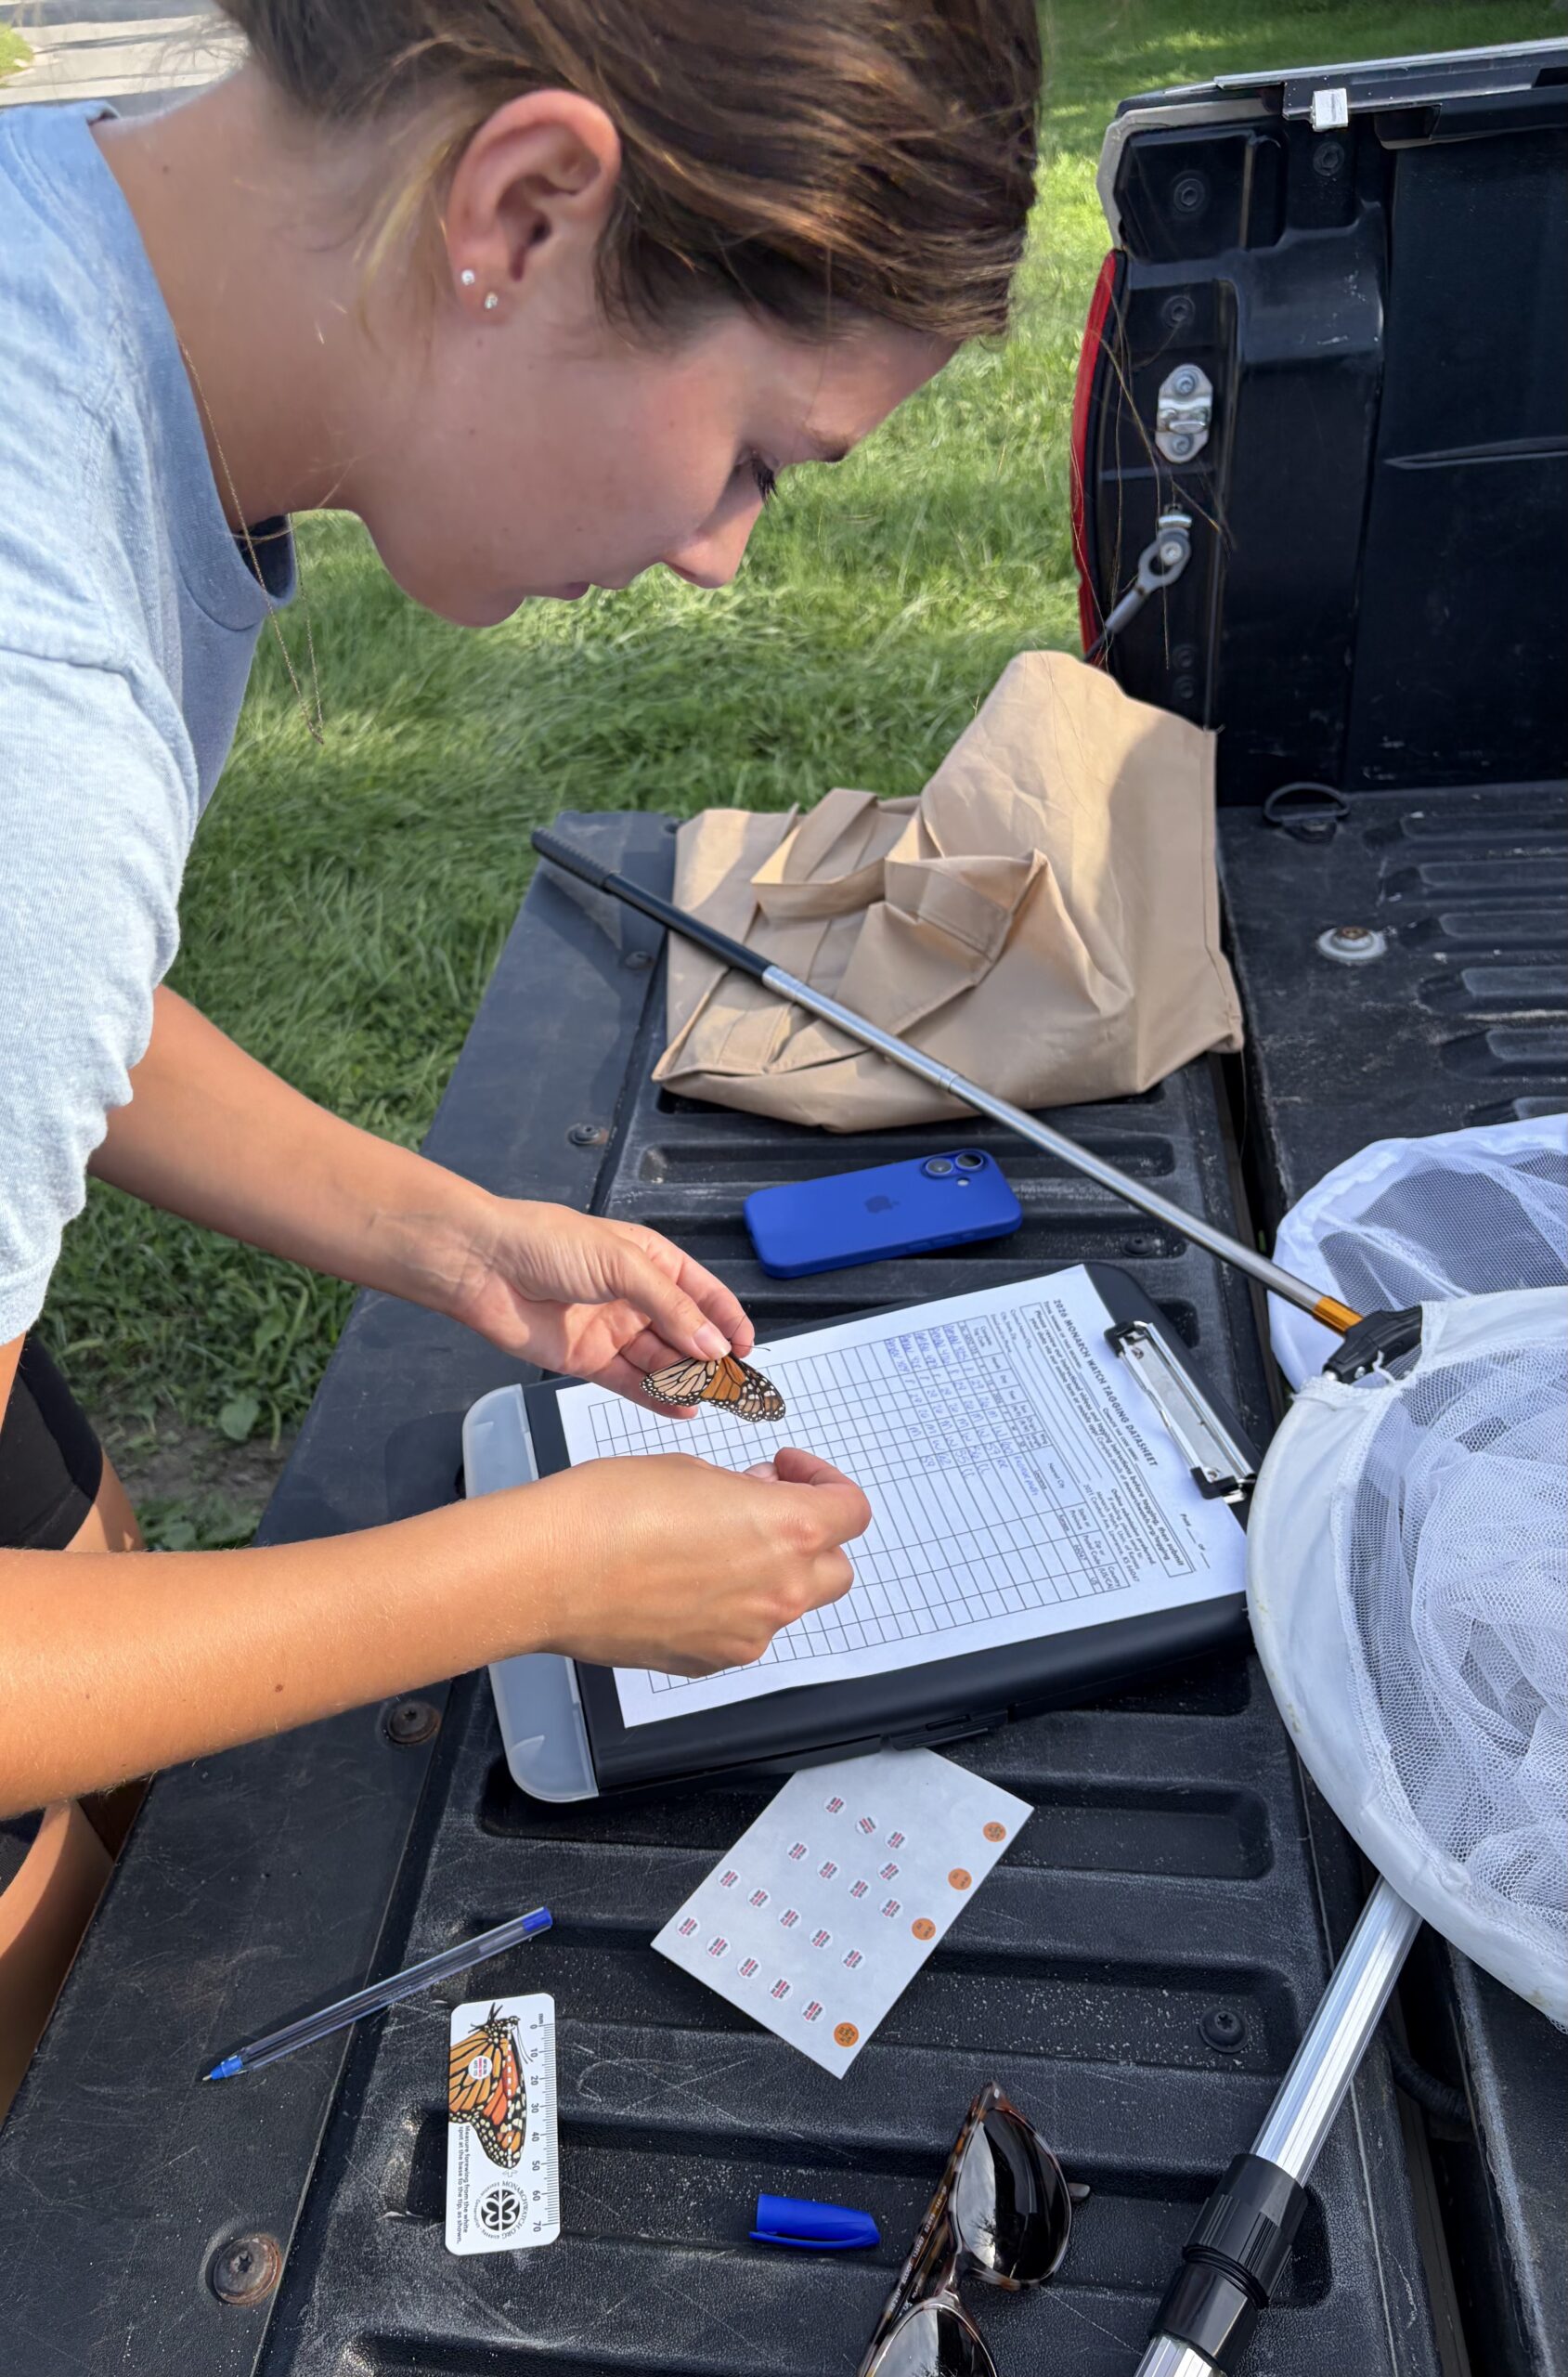
As summer winds down and fall gets underway, the Conservancy is exploring a brand-new pilot program: monarch tagging. The initiative was started by Kristen Peterson, working alongside Anna White, as a first-year effort to bring the Conservancy into Monarch Watch’s long-running national tagging program, a community science effort that’s been tracking monarch fall migration since 1992. As part of getting the pilot off the ground, Kristen and Anna have been scouting sites across the island with strong pollinator activity, prioritizing spots with abundant late-summer nectar sources like goldenrod and asters that attract monarchs as they fuel up for migration. Daily observation counts are being logged at these sites as part of Monarch Watch’s broader Calendar Project, tracking adult monarch activity throughout the season.
By the Numbers
- Program window: August 22 – late September/October 2026 (first pilot season)
- Average daily count: approximately 19 monarchs observed per day across monitored sites
- Total tagged so far: 30 monarchs tagged by Kristen and Anna
Timing matters a lot with monarchs, and it comes down to which generation is passing through. The monarchs seen on island in late August aren’t part of the regular summer breeding cycle, which produces butterflies that only live a few weeks. Instead, this is the “super generation,” a special migratory generation that enters a state called reproductive diapause, meaning they pause breeding entirely and redirect all their energy into building fat reserves for a long journey south. This generation lives dramatically longer than a typical summer monarch, often 6-9 months instead of just a few weeks. Once they head out, these monarchs travel an extraordinary distance, up to 3,000 miles, all the way to the oyamel fir forests of central Mexico, where millions of monarchs from across eastern North America cluster together on tree branches and trunks for the winter. Come spring, that same generation breaks diapause, mates, and begins the journey back north, laying eggs along the way to start the next breeding cycle. Every tag placed on a monarch carries a unique code. If that individual is ever recovered, whether spotted along the migration route or found at the overwintering grounds in Mexico, researchers can match the tag back to exactly when and where it was released. That single data point helps build a bigger picture nationally: how fast the migration is moving, how far individual monarchs are traveling, survival rates along the way, and how the population is shifting year to year.
Thank you to everyone who made this summer possible! We couldn’t do any of this without you, and we can’t wait to see what next season brings.